Authorship Pattern & Research Collaboration of Bifurcation Research During 2016-2020: A Scientometric Analysis
*Senior Library Information Assistant, Indian Institute of Technology, Bhubaneswar, Odisha, India dillipimmt@gmail.com**Technical Assistant, Knowledge Resource Centre, CSIR-Central Road Research Institute, New Delhi, India satyajitnayak555@gmail.com
Abstract
This study depicts a Scientometric technique of Bifurcation Research output in India for around five years during 2016-2020. It is an active field of analysis in which the bulk of investigation is being done. Scopus is an advanced research platform, assisting in finding, probing and yielding information in the sciences, social sciences, arts, and humanities. The contemporary study discusses the “Bifurcation” as reflected in SCOPUS for 2016-2020. This study examines the highly prolific authors, document type etc. The study exhibited that 2017 shown maximum research papers 1700 (20.44%), the lowermost maturity rate was deciphered in 2018 (19.65%), the standard value of the period of collaboration is 0.18. The time series examines for single-authored, multi-authored, and collaborative papers are 137.8, 1564 and 1701.8 respectively.
Keywords:
SAP, MAP, Collaboration, Time Series, VOSViewer1. Introduction
Scientometrics is one of the most widely used methods for evaluating scientific works. It is the quantitative study of the disciplines of science based on published literature and communication (Mooghali et al., 2011). The bibliometric, scientometric, and informetric techniques are used to examine numerous quantitative and qualitative qualities of a publication (Rajendran, Jeyshankar, & Elango, 2011). At present scientometrics study is one of the truly interdisciplinary research fields extended to almost all scientificfields (Singh, Nayak, & Varma, 2017). The term “Bifurcation theory” is the analytical subject of changes in a distributed family’s qualitative composition of a given family, Such as the essential circuits of a family of vector domains and the interpretations of a family of differential equalizations (Zhou, 2013). Nayak et al. (2021) indicated that ASLIB journal of information management publishes high-quality research articles on a variety of library and information science topics. The Journal Citescore is 3.3, SJR is 0.558, and SNIP is 1.132, according to Scopus.
Parida et al. (2020) evaluated the Research Productivity and Visualization of AIIMS, Bhubaneswar during 2012-2019. The results of the study showed that a total of 734 publications were received during the study period. Journal of Clinical and Diagnostic Research is the highly Preferred Journals with 67 articles. Various scientometric parameters have been applied to analysied the authorship patteren and collaboration, collective index, collaborative coeffiecient, dominance factor. Nayak (2018) analysed the articles published in the DESIDOC journal of library and information technology (2012-2016). The study analysis revealed that B.M Gupta was the most prolific author by contributing 11 articles. Two authors have made major contrubations to the journal with 45.58% publications. Singh, Nayak, and Varma (2017) examined the articles published in the Partnership: The Canadian journal of library and information practice and research 2010-2016. The study finding revealed that maximum number of contributions 52 (18.98%) were published in the year 2011. Single authorshave made major contribution to the journal with 187 publications. Balesetal. (2014) studied the Associating co-authorship patterns with publications in high-impact journals. The study analsysed the report based on ISI journal citation report.
2. Objectives
The purposes of study as follows:
- ∙ To study authorship patterns in Bifurcation literature.
- ∙ To analyze the year-wise single and multi-authored papers.
- ∙ To analyze the DC (Degree of Collaboration) in the field of Bifurcation.
- ∙ To analyze the time series analysis in the area of Bifurcation.
- ∙ To analyze the language wise published paper in the field of Bifurcation.
- ∙ To specify the different funding agency and their no of projects woring in the field of Bifurcation.
- ∙ To explain the occurrence of keywords in overlay visualization.
3. Methodology
Data was extracted on 05th January 2021 for a period of 5 years (2016-2020) from Scopus in .xls format. The search string appeared was “TITLE-ABS-KEY (bifurcation)” AND “Bifurcation (mathematics)” OR “Bifurcation” OR “Bifurcations” AND 2020 OR 2019 OR 2018 OR 2017 OR 2016. All the retrieved data were rigorously studied using Microsoft excel sheets to fulfill the specifications. Data visualization exercising Vos viewer software is also practiced to perform a more immeasurable compromise.
4. Investigation
Based on the collected data, the authors have conducted the analysis in the following segments with the necessary tables, figures, and graphical representations:
The below Table. 1 illustrates that a sum of 27257 contributors have committed to the 8319 articles and the common number of authors per papers recognized to be 3.27. Among 8319 papers, 784 (9.42%) are written by a single-author and 7535 (90.58%) by multiple-authors. For authored articles, the highest percentage was 2365 (28.43%), after Two written articles 2246 (27%) of the aggregate 8319 papers and five to seven are inserted 10 to 1 percent. Above eight written contributions are under one percent of reports. In this manner, showing the increasing trend towards multiple-authorship unmistakably is predominant associated to single-authorship in the case of Bufrication in India. The below table demonstrates the diminishing number of authors as far as a group or team research concerning more than three authors.
4.2 DC (Degree of Collaboration)
“The formula given by K Subramanyam (Subramanyam, 1983) helps determine the degree of collaboration in quantitative terms”
- DC=
- Where,
- DC= Degree of Collaboration in a discipline
- Nm=Number of Multi Authored papers
- Ns=number of Single authored papers
- Here Nm is 7535 and Ns is 784
- DC== 0.90
- i.e, DC is 0.90
Table 2 outlines that the single-authored papers are carried only 784 (9.42%) throughout the periods and multi-authored papers 7535 (90.58%). The analysis found that single-authored papers kept a low profile among Bufrication research. The multi-authorship exemplar is growing slowly in the corresponding field.
4.3 Time-Series investigation (Single-authored papers)
“The straight line equation to used to arrive at projections for expected growth under Time-Series analysis. Straight Line equation: ”
yc=a+bx
a=
=No. of papers by single-author
N=No. of years, a=784/5=156.8
,
= No. of x2 tables
b= (-19)/10 = -1.9
Evaluated research in 2025 is when x=2025-2016 (Mid Year), x=10
Implement straight line equation, yc=a+bx
Time Series Analysis (Multi-authored Papers)
“The straight line equation to used to arrive at projections for expected growth under Time-Series analysis. Straight Line equation: ”
yc=a+bx
a=
=No. of multi-author
N=No. of years, a=7535/5=1507
,
= No. of x2 tables
b= 57/10 = 5.7
Evaluated research in 2025 is when x=2025-2016 (Mid Year), x=10
Implement straight line equation, yc=a+bx
Time-series analysis (Collaborative Papes)
“The straight line equation toused to arrive at projections for expected growth under Time-Series analysis. Straight Line equation: ”
yc=a+bx
a=
=No. of multi-author
N=No. of years, a=8319/5=1663.8
,
= No. of x2 tables
b= 38/10 = 3.8
Evaluated research in 2025 is when x=2025-2016 (Mid Year), x=10
Implement straight line equation, yc=a+bx
On the utilization of the method of Time-Series separation for the expectation of bifurcation interpretation making in India over the year 2020, it was observed that the determined inclination and growth in bifurcation analysis literature amount might exert an expanding trend in single-authored papers (yc = 137.8) through the times to proceed. Collaborative papers intentions are also growing continuously (yc = 1701.8).
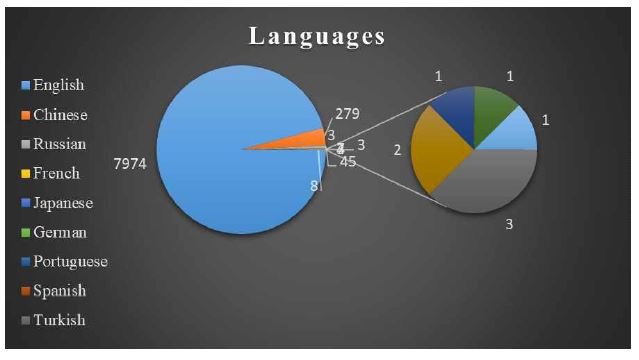
The Fig. 1 represents the papers published related to Bifurcation in 12 different languages. The maximum 7974 no of articles published in English followed by 279 nos. in Chinese. Persian and Ukranian has lowest no of publication 1each respectively.
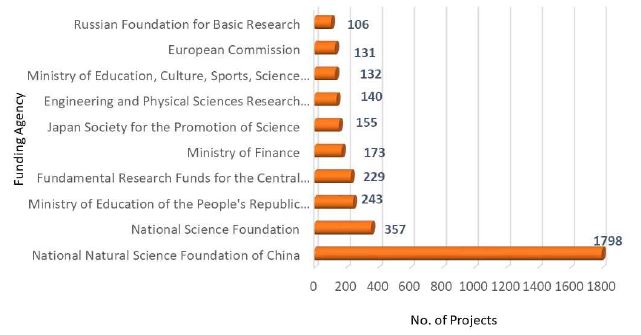
There are prolix worldwide fundraising bodies for researchers for bifurcation, which seldom accomplish in several research bodies and academies throughout numerous plans. Bifurcation has carried out many ever-smaller analysis outlines based on approaching the gains of institutional funding, as shown in Fig. 2. Overall, aforementioned determines the National Natural Science Foundation of China 1798 (24.56%) research projects and then 357 (4.8%) by the National Science Foundation. The outstanding funding bureaus are intimated in the following figure.
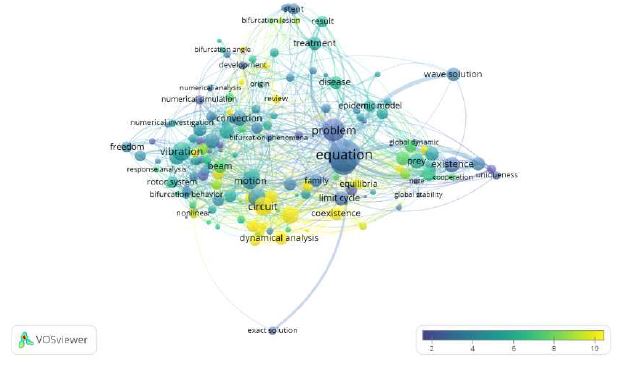
The Fig. 3 represeents the overlay visualization of title keywords of total link strength over average citation. The minimum no. of occurrence of a term is 10 out of 17765 terms, 269 meet the origin. Forspecific of the 269 terms, a pertinence record will be determined. Based on this number ,the usualrelative words to be selected is 60%. Uneqaled word “Computational study” has occurrence is 11 and has highest no of relevance is 3.37 followed by “bifurcation angle” occurrence is 18 and relevance is 2.17 .The term “bifurcation point” occurrence is 39 and lowest no of relevance is 0.43.
5. Findings of the Study
- ∙ Annual Growth Rate: In year 2017 has highest no. of output in the field of bifurcation 1700 (20.44%) while lowest in 2018 with 1635 (19.65%).
- ∙ Authorship Pattern: Single author produced only 784 (9.42%) publications while joint authorship produced 7535 (90.58%) publications out of 8319 research papers contributed in bifurcation.
- ∙ DC from 2016 to 2020in the field of bifurcation research is 0.09.
- ∙ The most crucial no of articles published in English is 7974.
- ∙ To obtained the overlay visualization of occurrence of keywords.
6. Conclusion
In this study directs an authorship patterns towards collaborative research is seen reliable during 2016-2020 in the area of bifurcation analysis output in India. The enhanced trend towards multiple-authorship is prevalent as compare to single-authorship in the occurrence of bifurcation in India. In the study, the degree of collaboration value varies of 0.18 to 0.19 percent and the mean is 0.18. The outline obtained such single-author papers prepared a low profile among bifurcation research scientists and the multi-authorship pattern is expanding slowly in Indian bifrucation research and maximum no of paper published in English language.
References
-
Bales, M. E., Dine, D. C., Merrill, J. A., Johnson, S. B., Bakken, S., & Weng, C. (2014). Associating co-authorship patterns with publications in high-impact journals. Journal of biomedical informatics, 52, 311-318.
[https://doi.org/10.1016/j.jbi.2014.07.015]

- Elango, B., & Rajendran, P. (2012). Authorship trends and collaboration pattern in the marine sciences literature: a scientometric study. International Journal of Information Dissemination and Technology, 2(3), 166-169.
- Khaparde, V., & Pawar, S. (2013). Authorship pattern and degree of collaboration in Information Technology. Journal of Computer Science & Information Technology, 1(1), 46-54.
- Mooghali, A., Alijani, R., Karami, N., & Khasseh, A. A. (2012). Scientometric analysis of the scientometric literature. International Journal of Information Science and Management (IJISM), 9(1), 19-31.
- Nayak, S. (2018). Research output of DESIDOC Journal of Library and Information Technology: A Scientometric Analysis. International Journal of Library and Information Studies, 8(1), 174-180.
- Nayak, S., Hari, P. K., & Verma, N. (2021). Research Trends in Annals of Library and Information Studies (ALIS): A Bibliometric Review from 2011-2021. Library Philosophy and Practice (e-journal). 6584. https://digitalcommons.unl.edu/libphilprac/6584
- Nayak, S., Parida, D. K., Verma, N., & Hari, P. K. (2021). Bibliometric Analysis of the ASLIB Journal of Information Management from 2014 to 2021. Library Philosophy and Practice (e-journal). 6605. https://digitalcommons.unl.edu/libphilprac/6605
- Parida, D. K., & Nayak, S. (2021). Research Trends in Evidence based Library and Information Practice (EBLIP) from 2011-2020: A Citation analysis. Library Philosophy and Practice (e-journal). 6484. https://digitalcommons.unl.edu/libphilprac/6484
- Parida, D. K., Singh, K., Kuri, R., Pradhan, A., Gireesh Kumar, T. K., & Singh, M. (2020). Research Productivity and Visualization of the All-India Institute of Medical Sciences (AIIMS) Bhubaneswar during 2012-2019: A Scientometric Approach. Library Philosophy and Practice (e-journal), 4639, 1-16. https://digitalcommons.unl.edu/libphilprac/4639
- Pillai, K. G. S. (2007). Authorship patterns in physics literature: An informetric study on citations in doctoral theses of the Indian Institute of Science. Annals of Library and Information Studies 54, 90–94.
-
Pintér, A. (2013). Changing trends in authorship patterns in the JPS: Publish or perish. Journal of Pediatric Surgery, 48(2), 412-417.
[https://doi.org/10.1016/j.jpedsurg.2012.10.069]

- Rajendran, P., Jeyshankar, R., & Elango, B. (2011). Scientometric analysis of contributions to journal of scientific and industrial research. International Journal of Digital Library Services, 1(2), 79-89.
- Scopus. (2021, January). Retrieved January 5, 2021, from https://www.scopus.com/search/form.uri?display=basic
- Singh, K., Nayak, S., & Varma, A. K. (2017). A scientometric analysis of partnership: The Canadian Journal of Library and Information Practice and Research (2010-2016). International Journal of Library and Information Studies, 7(3), 81-88.
- Singh, K., Singh, M., Patel, A. K., TK, G. K., & Nayak, S. (2021). Research Productivity of DESIDOC Journal of Library and Information Technology: A Bibliometric Review. 5703. https://digitalcommons.unl.edu/libphilprac/5703
-
Subramanyam, K. (1983). Bibliometric studies of research collaboration: A review. Journal of information Science, 6(1), 33-38.
[https://doi.org/10.1177/016555158300600105]

-
Velmurugan, C., & N. Radhakrishnan. (2015). Scientometric observations of Authorship Trends and Collaborative Research on DESIDOC Journal of Library and Information Technology. Collnet J Scientometrics Informat Management, 9(2), 193–204.
[https://doi.org/10.1080/09737766.2015.1069957]

- Wikipedia contributors. (2021, October 17). Bifurcation theory. Wikipedia. https://en.wikipedia.org/wiki/Bifurcation_theory
-
Zhou T. (2013) Bifurcation. In: Dubitzky W., Wolkenhauer O., Cho K. H., Yokota H.(eds.) Encyclopedia of Systems Biology. Springer, New York, NY.
[https://doi.org/10.1007/978-1-4419-9863-7_500]

Mr. Dillip Kumar Parida works as a Senior Library Information Assistant in the Central Library, Indian Institute of Technology Bhubaneswar. He has more than 8 years of experience in the field of library and information science. His research interests include in ICT, Scientometric and Bibliometric etc.
Mr. Satyajit Nayak is working as a Technical Assistant in the Knowledge Resource Centre, CSIR-Central Road Research Institute, New Delhi. He has received his MLISc and Mphil degrees from Utkal University, Bhubaneswar. He has more than 6 years of experience in the field of library and information science. His research interests include Information Science, ICT Application in Libraries, Scientometric, and Bibliometric etc. He has published more than 20 research articles in national and international journals.


