A Comparative Bibliometric Analysis and Visualization of Indian and South Korean Library and Information Science Research Publications During 2001–2020
Abstract
The paper aims to present a comparative analysis of scholarly research output in the fields of Library and Information Science (LIS) in India and South Korea.
The Web of Science database was used to retrieve the bibliographic data of the Indian and South Korean LIS published documents during 2001–2020 and the indicators were included in the analysis: research productivity, publication-quality, most prolific authors, institutions and journals, “Annual Growth Rate (AGR)”, “Compound Annual Growth Rate (CAGR)”, “Relative Growth Rate (RGR)”, and “Doubling Time (DT)”. All types of documents such as articles, conference papers, book reviews, corrections, editorial materials, so on were included in the study. MS Excel, VOS viewer, and bibliometrix (R-tool) software were used for tabulation and mapping.
The results show that South Korea placed the top in the overall output of LIS research publications during the last two decades. The Indian LIS research output, Annual Growth Rate (AGR), and Compound Annual Growth Rate (CAGR) were good compared to South Korean LIS publications. In addition, the South Korean LIS researchers’ output has increased rapidly in terms of publications, citations, average citations. Gangan Prathap (India), Seyoung Lee, and Heejin Lee (SK) are the most prolific authors; Indian Institute Technology, Delhi and Yonsei University, Seoul are the most prolific institutions; and the Scientometrics journal was the most preferred journal by the Indian and South Korean LIS researchers during the study period.
The results of this study are useful to administrators, policymakers, and academics. In addition, the scope of this study might include looking at research published by LIS scholars in India and South Korea, as well as examining all types of academic publications.
Keywords:
Research Productivity, Library and Information Science, India, South Korea, Bibliometrics Study, Visualization1. Introduction and Background
Relations between India and South Korea have changed significantly in recent years. Since President Moon Jae-in presented his New South Policy (NSP) in November 2017, the interaction between New Delhi and Seoul has improved significantly. This is the first South Korean foreign policy initiation for India and South Korea found a way to become a part of the Indo-Pacific union. Later, Several conferences and seminars were held with renowned Korean scholars and diplomats discussing the role of Korea in the Indo-Pacific era (Jang, 2018). All these successes were done with Indo-Korean diplomatic exchanges, especially in the past decade.
Research productivity assessment is an analytical tool required to maintain a high level of research performance. The evaluation also plays an important role in decision-making and policymaking. Over the years, LIS practice has been understood as a professional field and scientific research. India and South Korea have been showing their interest in the library and information science (LIS) research community in studying research trends in LIS as a subject.
The growth of the LIS subject as an interdisciplinary subject has been attractive to the LIS research community, and (Prebor, 2010) mentions that the role and influence of technology in libraries and library services are the main reasons for the interdisciplinary nature of LIS. A study by (Milojević, et al., 2011) found that integrating technology with the LIS theme changed the cognitive structure of the LIS system. There has also been a clear trend where traditional LIS issues have disappeared, new ones have emerged, and most of these emerging issues are related to technology (Larivière, Sugimoto, & Cronin, 2012). The integration of these technology-related topics has made LIS an interdisciplinary topic.
Indian and South Korean LIS researchers have contributed their research results significantly in scholarly journals. Importantly the researchers engage themselves in research in order to add value to the LIS field. Especially the Indian researchers should target the international quality journals for publishing their research output, and Indian publishers should make efforts to get space in international databases. Library and Information Science is a significant applied discipline and a great deal of literature is being produced. Web of Science is a major database that covers major journals on the subject. Hence, this comparative bibliometric study is an effort being made to assess the Indian and South Korean LIS research output. The inferences drawn based on this research can be very helpful and describing the research contributions and will help to understand the strengths and weaknesses of the discipline (Hasan & Singh, 2015).
2. Previous Studies
Bibliometrics has been an important and distinctive research tool in science mapping for decades. All the major collections of scientific indicators are strongly based on publications and total citations, more advanced bibliometric techniques. Over the last few decades, there has been a growing interest in the use of scientometric information to evaluate or monitor research activities. The discipline dedicated to the quantitative study and assessment of scientific literature is called scientometrics or bibliometrics. The purpose of scientometrics is to provide quantitative measurements of scientific activity. Because of the special importance of publications in the scientific community, it largely overlaps with bibliometrics, which is the analysis of the quantity of information in any written form.
Although both countries have extended support and assist in research and development, their research performance is rarely studied. (Elango, Oh, & Rajendran, 2021) assessed and compared the scientific research productivity of India and South Korea using the Scopus database during 1998–2018. In comparison, to India, South Korea has a higher share of publications containing international collaboration. In a few areas, both countries have stronger positions. (Gupta, 2010) conducted a comparative bibliometric study on overall science and technology research publications of India, South Korea, and China using the Scopus database. (Pattanashetti & Harinarayana, 2017) examined and compared the mechanical engineering research publications of India, South Korea, and Japan during 2000–2014 using SCI–WoS database. The study observed the increasing trend in collaboration in all the S&T fields. (Sweileh & Moh’d Mansour, 2020) conducted detailed bibliometric study on antimicrobial resistance (AMR) in the environment of the global scientific literature during 2000–2019. (Magnone, Surwase, & Kademani, 2017) examined India’s and South Korea’s co-publications from 1994 to 2013 using the Scopus database. (Ahmad, Sheikh, & Rafi, 2019) examined the scholarly publications in LIS based on the WoS database during 2003–2017, and findings revealed that the USA has contributed the maximum papers.
Several bibliometric studies on LIS research have been published. However, none of these studies compare India and South Korea. (Garg & Sharma, 2017) analysed 2,428 LIS research papers during 2004-2015 using the Indian Citation Index. It is noteworthy that ICI does not include all LIS journals published in India. (Mukherjee, 2010) analysed the LIS papers published in SSCI of WoS indexed journals by Asian countries during 2001-2007. The study shows the publication growth rate doubled during the study period and Chinese authors contributed maximum papers. (Han, et al., 2014) performed a scientometric analysis to study the trends, networks, and core groups of the international collaboration in LIS publications at the national and institutional level. (Sahu & Parabhoi, 2020) examine current trends in Indian LIS publications from 2014 to 2018. (Bhakta, Kar, & Bhui, 2019) did a bibliometric mapping of LIS research in India using the Indian Citation Index during 2006–2015.
(Yang, Lee, & Choi, 2016) examined the publication and citation patterns among subject areas of LIS research in Korea. (Lee & Choi, 2013) explores the citation rate of Korean Library and Information Science (LIS) subject areas. (Jabeen, et al., 2015) conducted the bibliometric study at the global level to understand the growth and trends of LIS publications. (Hasan & Singh, 2015) conducted the scientometric study and assessed the growth trend of the world LIS research output during 1975–2012 using the WoS database. (Olmeda-Gómez & de Moya-Anegón, 2016) Between 2003 and 2012, ten bibliometric indicators were used to evaluate the intensity of European publication of Scopus journals in the thematic category “Library and Information Sciences”. (Park & Nam, 2016) examined a co-authorship network at the institutional level based on articles published in eight Korean LIS journals during 2008–2012.
All the above studies were revealed either the annual research productivity and growth, the research productivity of the institution, the collaboration of the authors in the research work, most prolific authors, most cited papers in various disciplines, and so on. Whereas, none of the studies are compared the LIS research output among India and South Korea.
The current study seeks a quantitative and comparative analysis of the LIS research output of India and South Korea using the WoS database during 2001–2020. More specifically, the annual performance of research growth, prolific authors, institutions, journals, and highly cited papers of both countries are discussed.
3. Data and Methodology
The Web of Science database was chosen as the primary data source for this study because it has been used extensively in previous studies (Hasan & Singh, 2015; Kappi & Biradar, 2019; Kolle, 2017; Yang & Lee, 2012). In the Web of Science (SCIE, SSCI, and A & HCI) advanced search option, the Subject field ‘SU = Library and Information Science’, and the country were selected as “CU = India” (query 1) and “CU = South Korea” (query 2). The search was performed on July 2021 and the study period was limited to 2001–2020. Finally, we obtained the bibliographic records of 1288 of India and 1945 of South Korea, respectively. The collected data were tabulated with MS Excel. The VOS viewer software (Van Eck & Waltman, 2010) and Bibliometrix R tool (Aria & Cuccurullo, 2017) package were used for network visualization.
In this study Annual Growth Rate (AGR), Compound Annual Growth Rate (CAGR), Relative Growth Rate (RGR), and Doubling Time (DT) indicators were used to analyses and compare the LIS research output of both countries. Further, the study compared the annual research performance, citation analysis, most prolific authors, institutions, most preferred journals, and highly cited papers of India and South Korea.
4. Data Analysis and Interpretation
Table 1 summarizes the search results. This shows India’s and South Korea’s LIS research productivity of two decades (2001–2020). All types of documents and sources are considered for the study. Also provides the total authors, authors of single papers, multi-authored papers, total keywords, total author keywords, author collaborations. A total of 1288 and 1945 documents were produced at the average 7.3 and 7.34 publications per year by India and South Korea. All these documents were received an average citation of 1.764 and 2.602 per year. This shows South Korea’s quality of publications. Authors collaboration is almost similar, whereas the Indian author’s collaboration index is (2.02) more than the South Korean author's collaboration index (1.31)
4.1 Year-Wise Research Productivity and Citation Analysis
Table 2 shows the growth of research publications and citations for the publications during the study period. South Korea is slightly ahead in publications compared to India during the study period, even though the publications were less compared to both countries. Indian publications contribution has increased from 22 in 2001 to 207 in 2020, with an average annual growth rate of 15.18%. whereas South Korea’s publication contribution has increased from 44 in 2001 to 177 in 2020, with an average annual growth rate of 9.81%. The proportion of the South Korean publications to the Indian publications showed an overall rising trend from 200% in 2001 to 116.07% in 2020.

Year-wise research productivity and Citation analysis of Indian and South Korean LIS publications during 2001-2020.
Indian 1,288 publications cited 14,608 times with an average (13.026) citations per paper, whereas the South Korean 1,495 papers were received 49,233 citations with an average (41.906) citations per paper. Which is comparatively more than thrice of Indian LIS publications. South Korean publications received an average h_index of 94 during the study period which is near twice the h_index (54) of the Indian publications.
4.2 Publications Growth Rate
Table 3 illustrates the publication’s annual growth rate in both countries. The analysis reveals that there is no consistency in the Annual Growth Rate of both countries. India’s highest at 100% AGR is observed in 2014 and the lowest -19.463% is found in 2012. However, South Korea’s AGR is observed at 55.556% in 2005 and the -40.909% lowest in 2002. The Indian average AGR is 15.18%, whereas the South Korean average AGR is at 9.81% during the study period. The AGR is calculated using the below formula and the variation of the AGR is shown in Table 3:
The compound annual growth rate is measured by taking the nth root of the total percentage growth rate, where n is the number of years in the period being considered. The below is the formula (Fernando, Mansa, & Pathburn, 2021) used to calculate the compound annual growth rate:
During the last two decades, there was a 12.52% increase in the number of annual research publications from India, cumulative from 22 publications in 2001 to 207 publications in 2020 (Table 4). Contradictory growth was found in both countries. The growth of Indian research productivity was comparable with the growth of South Korea, but with a numerically higher annual growth rate for India was (CAGR 12.52%) compared to South Korea (CAGR 7.6%) over the twenty years. The most notable growth in research productivity in India occurred in the first 5 years reaching a CAGR of 10.67%, compared to -1.16% for South Korea. Accordingly, the highest CAGR rate (12.51%) was found in India during 2001–2020, whereas the 8.62% highest CAGR rate was found in South Korea during 2011–2015.
4.3 Relative Growth Rate (RGR) and Doubling Time (DT) of Indian and South Korean LIS publications.
Table 5 explains the relative growth rate (RGR) and doubling time (DT) of LIS publications during the period from 2001 to 2020. The growth rates of all publications are measured based on the RGR and Dt model, which was developed by (Mahapatra, 1985). RGR is the growth in the number of papers/pages per unit of time, and Dt is directly connected to RGR. The mathematical expression of the average relative growth rate of papers in a specific period can be derived from the following formula:

Relative Growth Rate (RGR) and Doubling Time (DT) of Indian and South Korean LIS publications during 2001-2020.
Where,
RGR= Relative Growth Rate in a particular period;
W1 = Loge (natural log of the initial umber of publications);
W2= Loge (natural log of the final number of publications);
T1= the unit of initial ime;
T2= the unit of the final time
‘Doubling Time’ is directly related to ‘relative growth rate’. If the number of articles or pages on a topic double’s in a given period, the difference between the logarithm of the number at the beginning and the end of the period must be the logarithm of the number 2. If the natural logarithm is used, the difference is 0.693 (Beaie & Acol, 2009). Therefore, the below formula can be used to calculate the corresponding doubling time for each specific time interval and papers and pages.
The Relative Growth Rate (RGR) value of India’s LIS publications has fallen from 0.879 in 2002 to 0.109 in 2019, while the RGR in 2020 is 0.176. At the same time, the value of “doubling time” (Dt.) Increased from 0.788 in 2002 to 7.372 in 2013, but from 2014 to 2020 a fluctuating trend was found. The value of the relative growth rate (RGR) of LIS publications of South Korea has fallen from 0.464 in 2020 to 0.095 in 2020. At the same time, the doubling time (DT) value has increased from 1,494 in 2002 to 7,263 in 2020, and in between a few years were varied. This study shows that the quantity of LIS research in South Korea has increased compared to India over time.
4.4 Most Prolific Authors in LIS and Impact of Their Output
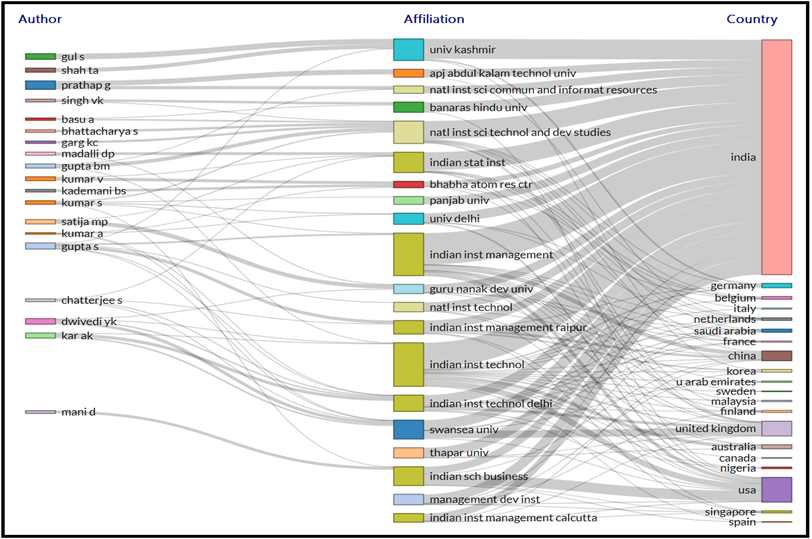
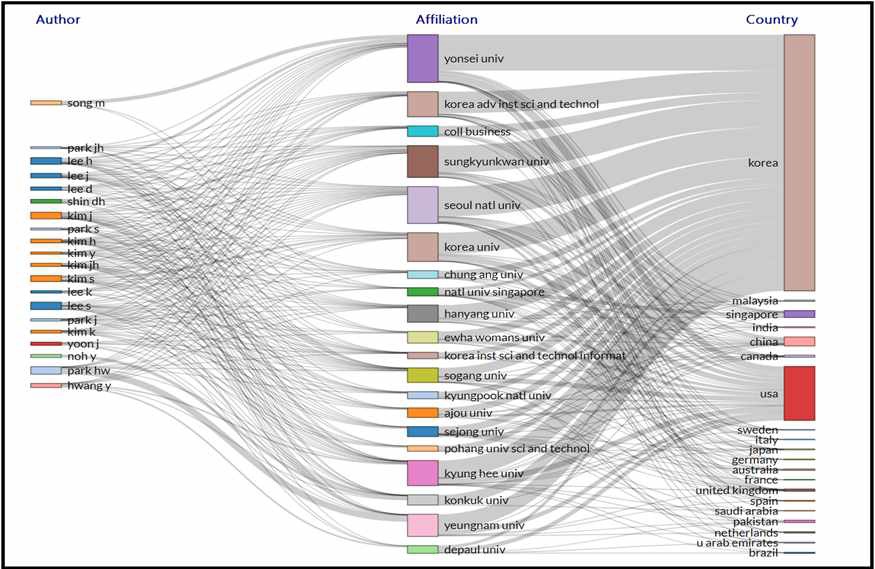
Table 6 and Table 7 display the most productive Indian and South Korean authors in the LIS field. The average number of authors per paper was 1.68 (Indian) and 1.18 (South Korea), and the top 18 authors who published 9 or more & 24 or more papers respectively. Both countries top 18 authors published 305 (23.7%) and 832 (43%) papers of the total publications respectively. The impact of Indian authors in terms of citations and an h_index indicates that among the listed 18 authors, five authors had lower citations (≤80) and h_index (≤6). It indicates that the research visibility of these five authors is lower than their research publications, and all the 18 authors together received 3,760 citations. Whereas, the impact of South Korean authors is different and they dominate the Indian authors. Of the 18 most prolific authors ‘Lee, Seyoung’, alone was received 4,658 citations for 78 papers, which is more than the total citations of the Indian top 18 authors. South Korean top seven authors were received higher (≥ 1000) citations and the remaining authors received notable (100 to 1000) citations. Overall, the South Korean authors have more impactful than the Indian authors in terms of publications, citations, and an h index of authors. Fig. 1 and Fig. 2 show both countries’ three fields Plot of ‘Authors–Affiliations–Countries’.
4.5 Most Prolific Institutions in LIS and Their Citation Impact
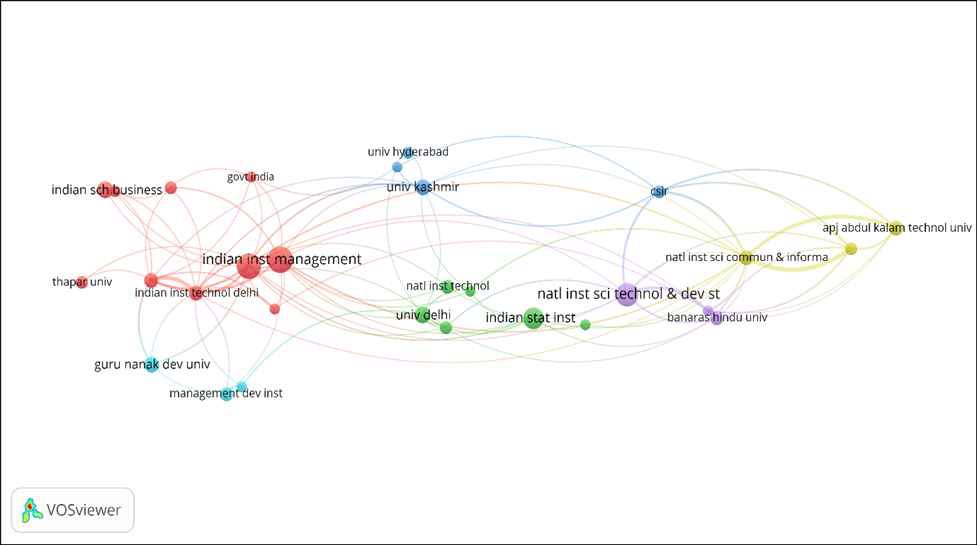
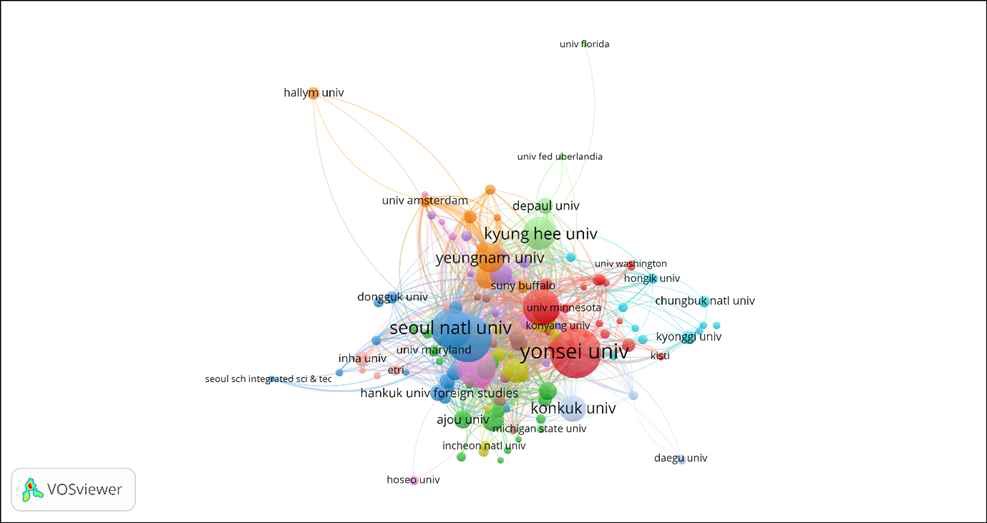
The data analysis indicates that 2,268 institutions scattered in different parts of the globe produced the total output in collaboration with India and South Korea. Table 8 and Table 9 show the top 20 most productive LIS institutions of India and South Korea. South Korea is an active country with fair output growth in LIS publishing comparative to Indian output. Such progress, which signifies the alliance of the research teams working in the subject area, is due to an increase in publications authored by researchers in the South Korean LIS institutes. The average number of Indian institutions per paper is 1.08 and South Korean is 1.80. The top 20 each Indian and South Korean LIS institutions produced 550 (42.70%; TC 7640) and 1,739 (89.41%; TC 48,984) papers respectively during 2001–2020. Among the Indian most prolific institutions, Indian Institute Technology, Delhi produced the highest number of papers (76), followed by Indian Institute Management (64) and CSIR–NISCAIR (51). Whereas, South Korea’s most prolific institutions are Yonsei University (260), KAIST, South Korea (220), and Seoul National University (162). The publication output of these prolific institutions was subjected to citation impact analysis in terms of ACPP. As mentioned in Table 1, the value of Indian ACPP for the total output was 11.34 and for the South Korean was ACPP was 25.31. The Citation analysis of India was shown in Fig. 3 and South Korea was shown in Fig. 4 respectively. The VOS viewer was used to create the Most Prolific Institutes citation network of India and South Korea. Citation and Organizations network has been applied to generate the network. In these networks, the size of the circles and colors are indicated the total papers published by the institutions. The larger fonts indicate the more citations received, carved and the thickness of the lines indicate the collaboration between the institutions. The closer the circles closer the collaboration.
4.6 Most preferred journals used for publishing LIS Research output by India and South Korea
Table 10 and Table 11 list the top 20 journals of the Indian and South Korean LIS researchers who preferred to publish their findings. These journals and their corresponding rankings are based on previous studies on the contributions of disciplines, countries/regions, and institutions to LIS journal literature are also used as criteria for selecting LIS journals with a good reputation (Walters & Wilder, 2016; Yuen, 2018). The wide range of subject areas in LIS and research publications were highly concentrated in these top journals and almost 70% of the articles of both countries were found in these top 20 journals. Among, eight journals (i.e., International Journal of Information Management, Journal of Global Information Management, Journal of Information Science, Journal of Knowledge Management, Journal of The American Society for Information Science and Technology, Online Information Review, Scientometrics, Telecommunications Policy) were commonly preferred by both the countries’ authors. Moreover, only the journal (i.e., Scientometrics) were highly preferred and top in the list published the most publications by the Indian (191) and South Korean (171) LIS institutes. ‘Electronic Library’ and ‘Telematics and Informatics’ were ranked second in the journal list by the Indian and South Korean LIS institutes with 104 and 138 papers each. International Journal of Information Management is ranked third in the journal list of the Indian LIS institutes with 69 papers; However, the South Korean LIS institutes have contributed 97 papers to this journal during the last two decades and placed 6th rank. Apart from the above three journals, the Indian LIS institutes have also contributed more papers to the Journal of Enterprise Information Management (57), Journal of Knowledge Management (51), and Program-Electronic Library and Information Systems (50) respectively. Whereas, the South Korean LIS institutes contributed more papers to the Information Processing and Management (138), Telecommunications Policy (114), and Information and Management. Although, the Indian and South Korean LIS institute researchers contributed more papers to the remaining journals also.
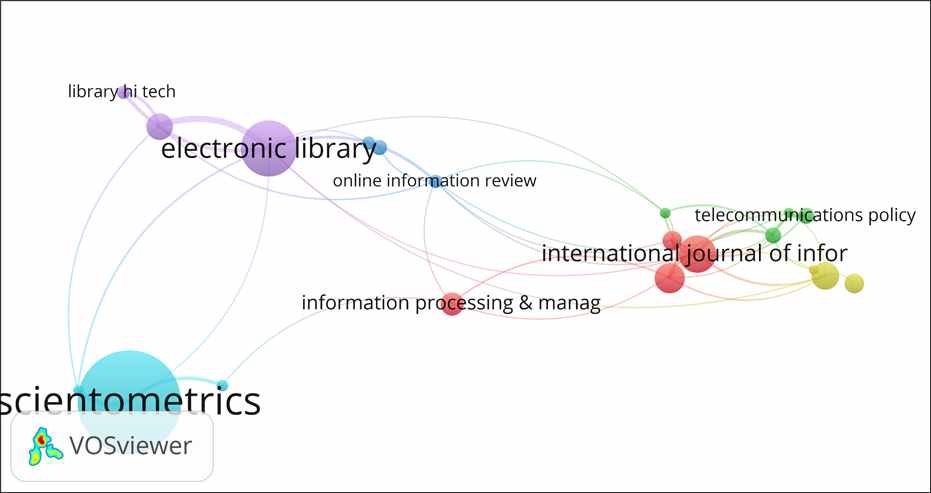
Fig. 5 presents the journals co-citation network of the Indian authors’ most preferred journals in the LIS (the minimum number of documents and citations in the journal is 19 and 10, respectively. Set of 81 sources, 21 met the threshold value). International journal of information management is in the middle of the network map with the most important links, though the electronic library, Scientometrics, Information Processing & Management, and Online Information Review are also in a significant place. In the journal co-citation analysis, journals were used as the units of analysis, as were the co-citations of pairs of journals, counted as the number of times pairs of journals are cited together. In Fig. 5, the circle size represents the activity of the journal and the number of published papers. The distance between the two circles is also significant. Generally, the smaller the distance between two circles is, the higher the citation frequency is, and see that all these journals are divided into six clusters. The red cluster contains Information Processing & Management, International Journal of Information Management, Journal of Enterprise Information Management, etc.
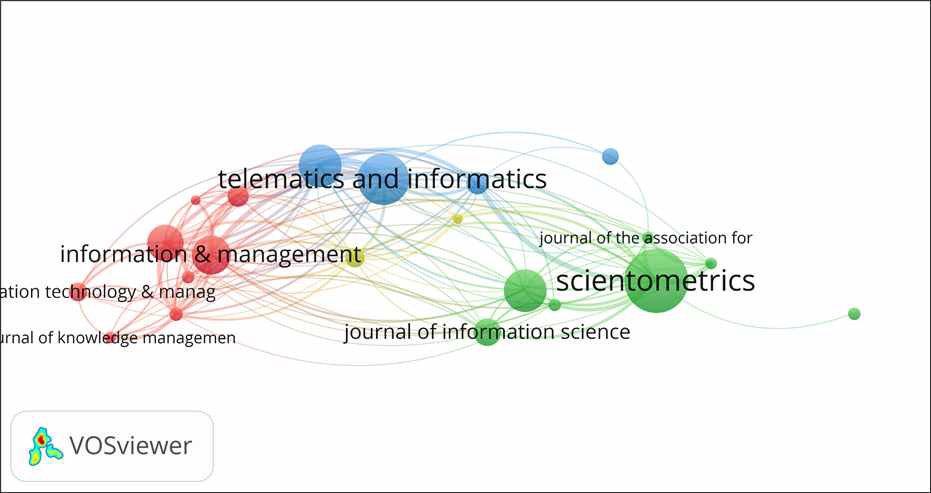
This cluster represents LIS Information processing and management journals. The blue cluster contains Scientometrics, the Malaysian Journal of Library & Information Science, and the Journal of The American Society for Information Science and Technology. This cluster represents bibliometrics and scientometrics journals. The green cluster represents Information Communication Technology journals. The yellow cluster represents knowledge management journals. The purple cluster represents the computer science and electronic library journals and the light blue cluster represents the information and technology journals. Fig. 6 shows the journal co-citation network of South Korean author's most preferred journals in the LIS (the minimum number of documents and citations per journal was 27 and 141, respectively. From a set of 83 sources, 21 met those thresholds). In this Fig. 7, all journals are divided into 4 clusters. The red cluster contains Information & Management, Information Development, Information Systems Research, Information Technology, and Management, etc. This cluster represents LIS Information systems and management journals. The blue cluster contains Government Information Quarterly, Journal of Health Communication, Telematics, etc. This cluster represents Information telecommunication Technology journals. The green cluster contains Scientometrics, Journal of Informetrics, Journal of Information Science, etc. This cluster represents bibliometrics and scientometrics journals. The yellow cluster represents the information review journals.
4.7 Highly cited papers LIS Research publication by India and South Korea
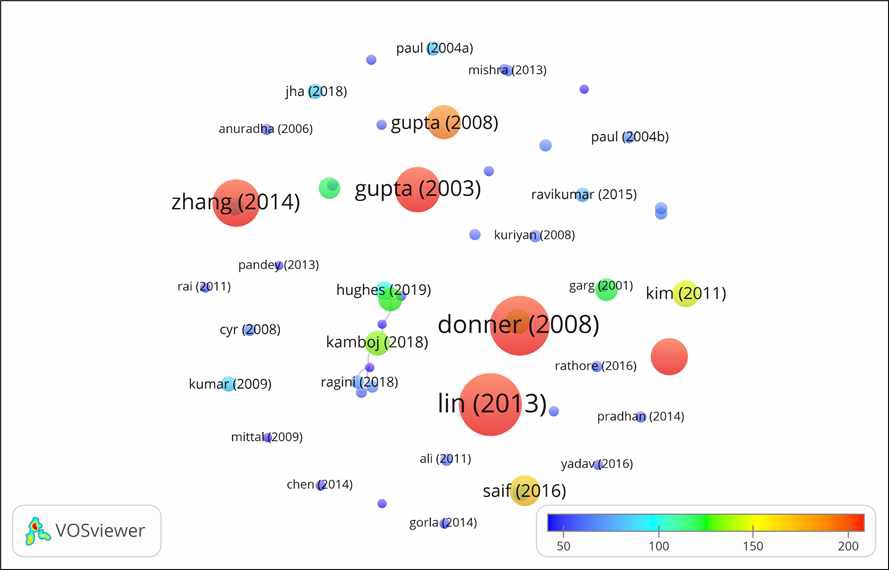
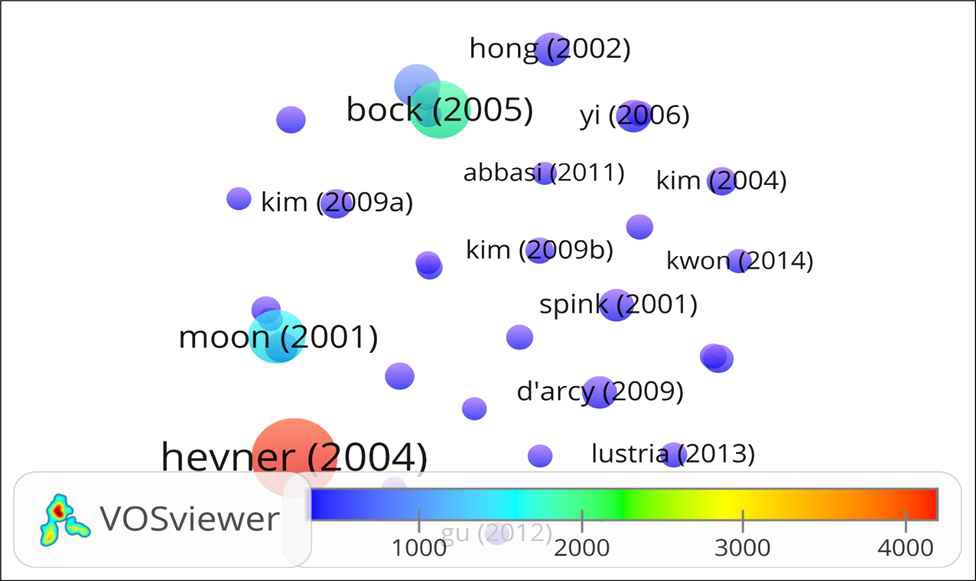
Table 12 and Table 13 specify the list of the Top 10 highly cited LIS papers published by authors from India and South Korea. Authors of the top 10 papers from South Korea were received the highest citations 11580 during the study period. Compared to South Korea, Indian authors have received fewer citations, accounting for 2170. South Korea’s top 10 papers are cited more than 530% as frequently as India’s top 10 papers. South Korea has a higher international collaboration rate than India. South Korean researchers are preferred to publish in highly-reputed, peer-reviewed international journals because the researchers are highly motivated and aware of the need to publish in those journals, and modern practices include digital traces that remain after collaborative research is completed (Shin, 2019). South Korean top-ranked LIS universities offer monetary incentives to researchers who publish more articles in international journals (Fuyuno & Cyranoski, 2006). Due to all these, South Korean researchers got the highest citations compared to Indian researchers. Both countries highly cited papers have been published in high-impact journals such as Information Systems Research, Information Society, Information & Management, Scientometrics, MIS Quarterly, and so on. Among them, Information & Management journal has published two Indian and four South Korean highly cited papers. The paper “Too Big to Fail: Large Samples and the p-Value Problem”, authored by Lin, MF; Lucas, HC; Shmueli, G with 339 citations and the “Design science in Information Systems research” a paper authored by Hevner, AR; March, ST; Park, J; Ram, S with 4202 citations were the top 1 ranked paper by India and South Korea respectively. Fig. 7 shows the Indian highly cited paper’s network with a minimum of 50 citations and, Fig. 8 shows the South Korean highly cited papers citations network with a minimum of 1000 citations. All the highly-cited papers are divided into 4 clusters according to their citation count and the circle represents each highly cited paper and the size denotes the total citations received; the color of the circle denotes the number of citations received during the last two decades.
All the highly-cited papers are divided into 4 clusters according to their citation count and the circle represents each highly cited paper and the size denotes the total citations received; the color of the circle denotes the number of citations received during the last two decades. In the figures, the colors are changing from dark to light, which shows the increasing citation counts (dark blue to light blue shows the citation counts from 1 to 50 and so on).
5. Discussions and Conclusion
Bibliometric analysis of publications productivity is to understand the growth of LIS Publications produced among India and South Korea which have had a common footing. The research publications in the LIS during 2001-2020 have been analysed. Both countries rapidly and steadily contributed to research publications. In fact, with South Korea’s publications as well as citations being in the prime. South Korea’s researchers/authors contributed good quality research results and received the highest citations for their research output during the study period. The study suggests India needs to increase the LIS research Quality as there are fewer citations. This may show that India can make significant competitive advantages in LIS Field. The growth patterns based on AGR and CAGR disclose that there is no common pattern among the countries and no consistency in the AGR of both countries. There is an increase in Indian CAGR value during 2001-2005, 2001-2010, decreased in 2001-2015, and again increased in 2001-2020. Whereas, an increase in South Korea’s CAGR value during 2001-2005, 2001-2010, 2001-2015, and decreased in 2001-2020.
Among these two counties, South Korea is at the top with 1945 publications, as well as in RGR and Dt value. In the cumulative impact factor, cumulative citations, articles in highly effective journals. This is not surprising, as there is a positive correlation between the number of publications and the overall impact factor, the cumulative citation of articles in highly effective journals. South Korea has the largest share of researchers moving from industry to academia in 71 countries between 2017 and 2019 (Dayton, 2020). In India, researchers understand the significance of collaboration. It suggested that Indian LIS researchers can involve in the quality and quantity of research output. The MoU will provide opportunities and support for individual researchers to engage institute partners and collaborate. In addition, the universities may have an approach to introduce dual affiliation positions or co-financing and supervising Ph.D. students to create opportunities for direct and close relationships that can build the foundation for next-generation collaboration.
Analysis of the most preferred journals can be helpful, exclusively for new generations of scholars, to gain insights into important publications in the field of LIS. Of the total journals, 70% of the LIS research output of both the countries were published in the top 20 preferred journals and 8 journals were commonly preferred. The 10 most cited papers revealed that the LIS researchers did not focus on a particular research area. Whereas the LIS researchers contributed more and published in allied subject areas. These papers are covered the latest dynamics of the subject, like the Application of Information technologies (Big data, Cloud computing, ICT-enabled libraries, application of social media, information systems, and so on) in the LIS field. All the highly cited papers are published in collaboration and South Korean papers were received the highest citations compared to Indian authors (Mallikarjun & Kappi, 2020).
The findings of this study are informative for administrators, policymakers, as well as scholars who care about India and South Koreas, rise in LIS. Each country can learn and gain mutual benefits from the other country through future collaboration in LIS and allied areas using different approaches. Likely, they can seek global excellence through cooperation, and in other areas where one country has a higher status than the other, that country can lead to cooperation in many ways. Further, it could be useful to LIS researchers with a snapshot of how the LIS field has evolved over a while and to facilitate the selection of research topics of current interest.
References
-
Ahmad, K., Sheikh, A., & Rafi, M. (2019). Scholarly research in Library and Information Science: an analysis based on ISI Web of Science. Performance Measurement and Metrics, 21(1), 18–32.
[https://doi.org/10.1108/PMM-06-2019-0024]

-
Aria, M., & Cuccurullo, C. (2017). Bibliometrix: An R-tool for comprehensive analysis of science mapping analysis. Journal of Informetrics, 11(4), 959-975.
[https://doi.org/10.1016/j.joi.2017.08.007]

- Beaie, S. T., & Acol, P. (2009). Population and Demographic Measures: Concepts and Definitions for basic MDG indicators. Kingston Georgetown, Guyana: Bureau of Statistics.
- Bhakta, J., Kar, S., & Bhui, T. (2019). Bibliometric mapping of LIS research in India: A study seen through the mirror of Indian Citation Index. Library Philosophy and Practice (e-journal). Retrieved from http://hdl.handle.net/10760/39881
-
Dayton, L. (2020). How South Korea made itself a global innovation leader. Nature, 581(7809), 54.
[https://doi.org/10.1038/d41586-020-01466-7]

-
Elango, B., Oh, D. G., & Rajendran, P. (2021). Assessment of Scientific Productivity by India and South Korea. DESIDOC Journal of Library &Information Technology, 41(3), 190–198.
[https://doi.org/10.14429/djlit.41.03.16558]

- Fernando, J., Mansa, J., & Pathburn, P. (2021). Compound Annual Growth Rate (CAGR). Investopedia. Retrieved from https://www.investopedia.com/terms/c/cagr.asp
-
Fuyuno, I., & Cyranoski, D. (2006). Cash for papers: putting a premium on publication. Nature, 441(7095), 792-793.
[https://doi.org/10.1038/441792b]

-
Garg, K. C., & Sharma, C. (2017). Bibliometrics of library and information science research in India during 2004-2015. DESIDOC Journal of Library and Information Technology, 37(3), 221.
[https://doi.org/10.14429/djlit.37.3.11188]

- Gupta, B. M. (2010). A comparative study of India, China and South Korea S&T publications output during 1999-2008. Annals of Library and Information Studies (ALIS), 57(3), 207–221.
-
Han, P., Shi, J., Li, X., Wang, D., Shen, S., & Su, X. (2014). International collaboration in LIS: Global trends and networks at the country and institution level. Scientometrics, 98(1), 53–72.
[https://doi.org/10.1007/s11192-013-1146-x]

-
Hasan, N., & Singh, M. (2015). Library and Information Science Research Output: A study based on Web of Science. Collnet Journal of Scientometrics and Information Management, 9(1), 47–64.
[https://doi.org/10.1080/09737766.2015.1027089]

- Jang, Y. J. (2018, September 3). CDTS Discusses S. Korean Diplkomacy in Indo-Pacific Region. The Argus. Retrieved from from http://www.theargus.org/news/articleView.html?idxno=1439
- Kappi, M., & Biradar, B. S. (2020). Overview of trends in Indian Optics Research (2008-2018). Library Philosophy and Practice, 1-18. Retrieved from https://core.ac.uk/download/pdf/286730186.pdf
-
Kolle, S. R. (2017). Indian Contribution in Information Science and Library Science Research during 1991-2015: A Bibliometric Analysis. DESIDOC Journal of Library & Information Technology, 37(6), 387–395.
[https://doi.org/10.14429/djlit.37.6.11005]

-
Larivière, V., Sugimoto, C. R., & Cronin, B. (2012). A bibliometric chronicling of library and information science’s first hundred years. Journal of the American Society for Information Science and Technology, 63(5), 997–1016.
[https://doi.org/10.1002/asi.22645]

-
Lee, J., & Choi, W. (2013). Difference in citation rates by subject areas of LIS in Korea. Proceedings of the American Society for Information Science and Technology, 50(1), 1-4.
[https://doi.org/10.1002/meet.14505001150]

-
Magnone, E., Surwase, G., & Kademani, B. S. (2017). Indo-Korean Co-Publications: An Analysis Using Asymmetric (α) Index. Journal of Scientometric Research, 5(3), 209–219.
[https://doi.org/10.5530/jscires.5.3.4]

- Mahapatra, M. (1985, July). On the validity of the theory of exponential growth of scientific literature. In Proceedings of the 15th IASLIC conference, Bangalore.
- Mallikarjun, B., & Kappi, M. (2020). Visualisation of Asthma Research Output in India during 2010-2019. Library Philosophy & Practice (e-Journal). Retrieved from https://digitalcommons.unl.edu/libphilprac/4253
-
Milojević, S., Sugimoto, C. R., Yan, E., & Ding, Y. (2011). The Cognitive Structure of Library and Information Science: Analysis of Article Title Words. Journal of the American Society for Information Science and Technology, 62(10), 1933–1953.
[https://doi.org/10.1002/asi.21602]

-
Mukherjee, B. (2010). Assessing Asian Scholarly Research in Library and Information Science: A Quantitative View As Reflected in Web of Knowledge. Journal of Academic Librarianship, 36(1), 90–101.
[https://doi.org/10.1016/j.acalib.2009.12.003]

-
Olmeda-Gómez, C., & de Moya-Anegón, F. (2016). Publishing Trends in Library and Information Sciences Across European Countries and Institutions. Journal of Academic Librarianship, 42(1), 27–37.
[https://doi.org/10.1016/j.acalib.2015.10.005]

-
Park, J. H., & Nam, E. (2016). Intra- and Inter-institutional Collaborative Pairing Trends of LIS Field in South Korea. Libri, 66(2), 125–136.
[https://doi.org/10.1515/libri-2015-0096]

-
Pattanashetti, D. M., & Harinarayana, N. S. (2017). Assessment of mechanical engineering research output using scientometric indicators: A comparative study of India, Japan, and South Korea. Journal of Information Science Theory and Practice, 5(2), 62–74.
[https://doi.org/10.17821/srels/2017/v54i2/111917]

-
Prebor, G. (2010). Analysis of the interdisciplinary nature of library and information science. Journal of Librarianship and Information Science, 42(4), 256–267.
[https://doi.org/10.1177/0961000610380820]

-
Sahu, R. R., & Parabhoi, L. (2020). Bibliometric study of library and information science journal articles during 2014-2018: Lis research trends in India. DESIDOC Journal of Library and Information Technology, 40(6), 390–395.
[https://doi.org/10.14429/djlit.40.06.15631]

-
Shin, E. J. (2019). Journal publishing and authorship in library and information science by early career researchers in South Korea. Journal of Information Science Theory and Practice, 7(1), 6–16.
[https://doi.org/10.1633/JISTaP.2019.7.1.1]

-
Sweileh, W. M., & Moh’d Mansour, A. (2020). Bibliometric analysis of global research output on antimicrobial resistance in the environment (2000–2019). Global Health Research and Policy, 5(1), 1–11.
[https://doi.org/10.1186/s41256-020-00165-0]

-
Van Eck, N. J., & Waltman, L. (2010). Software survey: VOSviewer, a computer program for bibliometric mapping. Scientometrics, 84(2), 523–538.
[https://doi.org/10.1007/s11192-009-0146-3]

-
Walters, W. H., & Wilder, E. I. (2016). Disciplinary, national, and departmental contributions to the literature of library and information science, 2007-2012. Journal of the Association for Information Science and Technology, 67(6), 1487–1506.
[https://doi.org/10.1002/asi.23448]

-
Yang, K., & Lee, J. (2012). Analysis of publication patterns in Korean library and information science research. Scientometrics, 93(2), 233–251.
[https://doi.org/10.1007/s11192-012-0663-3]

-
Yang, K., Lee, J., & Choi, W. (2016). Publication and citation patterns of Korean LIS research by subject areas. Malaysian Journal of Library and Information Science, 21(2), 67–81.
[https://doi.org/10.22452/mjlis.vol21no2.5]

-
Yuen, J. (2018). Comparison of Impact Factor, Eigenfactor Metrics, and SCImago Journal Rank Indicator and h-index for Neurosurgical and Spinal Surgical Journals. World Neurosurgery, 119, 328–337.
[https://doi.org/10.1016/j.wneu.2018.07.144]

-
Jabeen, Mu., Yun, L., Rafiq, M., & Jabeen, Mi. (2015). Research productivity of library scholars. New Library World, 116(7-8), 433-454.
[https://doi.org/10.1108/NLW-11-2014-0132]

Mallikarjun Kappi is a Librarian at Government First Grade College, Jagalur (affiliated to Davanagere University) and a Ph.D. candidate at the Department of Library and Information Science, Kuvempu University, Shivamogga. His research interests are open research data, scientometrics, and bibliometrics. His contributions to the current study are the review of literature, data collection, data interpretation, tabulation, and data analysis.
Dr. Biradar BS is currently working as a HOD and Professor in the Department of Library Science, Kuvempu University, India. His research interests include Information Technology, Bibliometrics, Information Sources and Services, Public Libraries. He is serving as an editorial member, reviewer of several international reputed journals, and member of many international affiliations. His contributions to this paper are research design, formulation of the problem, data organization, editing, reviewing and improvement of the contents to the final approved version.
